In the light of rising inflation, widening unemployment, depleting savings, and growing inequality, it is crucial to take stock of their profound and compounded implications, not only for the country as a whole but for our individual families and our overall quality of life.
By Aditi Anand and Adrian D’Cruz
As India enters General Elections, contrasting narratives emerge on leaders, poll pledges, and economic performance. The opposition critiques a perceived lackluster decade while the ruling government touts India’s global economic prominence and growth. A government’s economic performance however, must weigh the magnitude of the economy against its impact on the common citizen. A closer examination of comparative income, inflation data for daily household essentials and savings paints a dismal picture of the economy’s effects on Indian citizens
In the past decade, India has witnessed a concerning trajectory of economic inequality and inflation, painting a stark picture of disparities within its society. A recent study highlights that the current era, often dubbed the ‘Billionaire Raj,’ exhibits greater inequality than even the colonial-era British Raj. This widening gap in earnings and wealth distribution, coupled with an alarming concentration of riches, poses a significant threat to the economic stability and social fabric of the nation. Particularly distressing is the plight of educated youth, with a growing number unable to secure gainful employment, casting a shadow over India’s much-touted “positive demographic dividend.”
Furthermore, the soaring cost of essential commodities has compounded the challenges faced by ordinary citizens. Over the past decade, the prices of basic groceries have surged, with basic everyday items experiencing a staggering 68 per cent increase in cost. Daily essentials like tea, coffee, and pulses have seen their prices double or even triple, further burdening households. Data from the National Statistical Survey Office (NSSO) underscores this trend, revealing a notable uptick in monthly expenditure per person since 2012. When juxtaposed with a population surge of 20 crore people, the average savings per person have dwindled, as evidenced by household savings rate data from NITI Aayog. These alarming trends necessitate urgent attention and concerted efforts to address the widening chasm of inequality and the escalating inflationary pressures plaguing the Indian economy.
How unequally are we growing?
Recent findings from the World Inequality Report, penned by renowned economists including Thomas Piketty, shed light on India’s stark financial inequality. At present, the nation finds itself at its most financially disparate stage yet.
The report reveals striking figures: the average annual income of the bottom 50 per cent income group (70+ crore individuals)is Rs 71,000. The same for the top 1 per cent income group (1 crore individuals) is Rs 53 lakhs. Even more staggering is the income of the top 0.001 per cent (around 14,000 individuals), which amounts to Rs 48.5 crores annually.

Also according to the report, 22.6 per cent of the total income is going to the top 1 per cent in India, which is not only at a historically high level but it’s also higher than what the top 1 per cent are earning in even South Africa, Brazil and the United States. .
The report estimates underscore the fact that the ‘Billionaire Raj’ of today is more unequal than the British Raj headed by the colonialist forces. As these statistics reveal, the considerable gap between earnings and wealth of different income groups and the extreme concentration of wealth is making a majority of the citizens increasingly economically vulnerable and risking the slide towards plutocracy.
Widespread unemployment
The unequal growth is further being exacerbated by a significant increase in unemployment rates.
According to the latest data from the Centre for Monitoring Indian Economy (CMIE), India’s unemployment rate dropped to 6.8 percent in January, marking a significant decrease from 8.7 percent in December last year. However, this figure represents an increase from the 2014 rate of 5.44 percent, reflecting a concerning trend of rising unemployment over the past decade. The impact of COVID-related shocks further exacerbated the situation, with the unemployment rate peaking at 8 per cent in December 2023, nearly two years after the onset of the pandemic.
Particularly alarming is the growing number of educated youth unable to secure employment, signaling a troubling trend that could potentially undermine India’s celebrated “positive demographic dividend.”

It is vital to note that educated youth face disproportionately higher rates of unemployment. More than 65 per cent of unemployed individuals in India are educated, with an alarming 77 per cent of them being women. This glaring statistic underscores a troubling mismatch between skills and available job opportunities. The India Skills Report 2021 concerningly highlights that employability (having a set of skills, knowledge, understanding and personal attributes that have a positive effect on gaining and keeping a job) among formally educated individuals is consistently below 50 per cent since the report’s first edition in 2014. Additionally, 53 per cent businesses in India have been facing challenges in recruitment due to applicants’ insufficient skills since before the pandemic.
The limited job opportunities primarily favour unskilled and semi-skilled workers, while graduates and those with higher qualifications face sluggish employment growth, including technical degree holders. Although the unemployment rate (UR) declined across education levels from 2000 to 2011-12, it sharply increased from 2011-12 to 2017-18, affecting all educational categories.
Gross Value Added is defined as the measure of the value of goods and services produced in an area, industry or sector of an economy. It signifies the growth of the value of the economy but when not accompanied by simultaneous employment growth, it is a sign of ‘jobless growth’. According to the India Employment Report 2024, between 2000 and 2012, employment in India experienced an annual growth rate of 1.6 per cent, while gross value added grew at a much faster rate, at 6.2 per cent. This pattern was intensified between 2012 and 2019, when gross value added continued to grow at 6.7 per cent, but employment growth was nearly negligible, at 0.01 per cent.
Only 5 per cent of India’s labour force has received formal skill training, a stark contrast to countries like the UK (68 per cent), Germany (75 per cent), the US (52 per cent), Japan (80 per cent), and South Korea (96 per cent). Beyond unemployment, there exists a substantial segment of youth, particularly young women, who are neither in education, employment, nor training, as highlighted in the India Employment Report 2024.
According to the Periodoc Labour Force Survey of 2022-23, 2017-18 and NSS 68th round 2011-12, the monthly wages for a regular salaried worker in rural areas only grew from Rs 9,668 per month in 2012 to Rs 17,274 per month in 2023. The same for urban salaried/regular formal workers grew from Rs 13,489 to Rs 23,011. However, when adjusted for inflation, these figures are abysmal. According to the Consumer Price Index data extrapolated by taking into account official data from the Ministry of Statistic and Program Implementation, there has been a decrease in real wages in urban areas from 2012 to 2023. There has been an increase of only Rs 518 (3 per cent increase) in real rural wages.

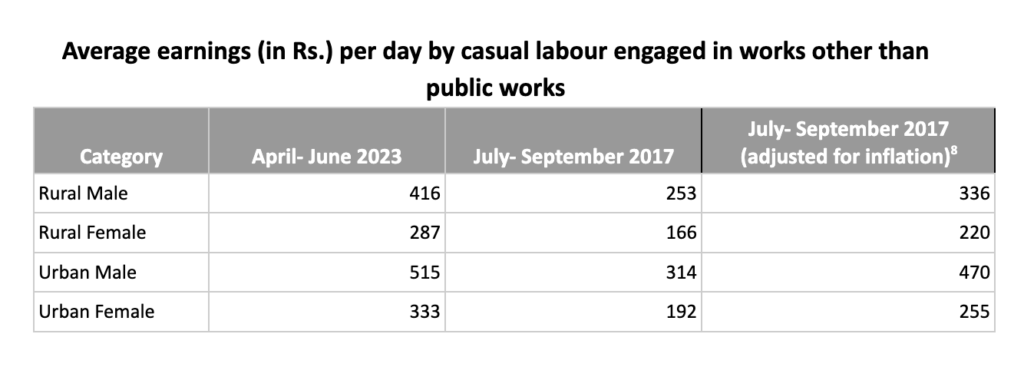
Moreover, the majority of the workforce, accounting for over 55 per cent, is engaged in casual labour, according to the same report. However, wages for casual labourers have seen only modest increases over the past decade. For instance, the average daily wage for rural male and female casual labourers grew only 23 per cent and 30 per cent respectively when adjusted for inflation. Urban daily wage for casual labourers has again only experienced a 23 per cent and 30 per cent increase respectively for men and women, which falls short in sustaining a decent quality of life, especially in light of the soaring inflationary pressures faced by citizens.

Rising costs: the burden of basic necessities
Household expenses in the past decade have seen an exponential surge in prices of essential items like dal, milk, sugar, coffee, and LPG. NITI Aayog in its 2023 report said that 74.1 per cent. Indians struggle to afford healthy food, and these figures have been corroborated by the UN.
There’s been a 68 per cent increase in cost of basic groceries for a week for a family of three (5 litres of milk, 2 kg of rice, 2 kg of wheat flour, 1 litre oil, pulses, a dozen bananas, 1 kg apples and 2 kg each of onions, potatoes and tomatoes) between March 2012 and March 2022, as per price data released by the Wholesale and Retail Price Information System.
Items like wheat have seen a consistent and exorbitant rise in prices. India’s cereal inflation averaged 10.65 per cent year-on-year in October 2023, based on the latest official consumer price index numbers. For comparison, general retail inflation was 4.9 per cent and the 6.61 per cent annual rise in consumer food prices was 6.61 per cent.
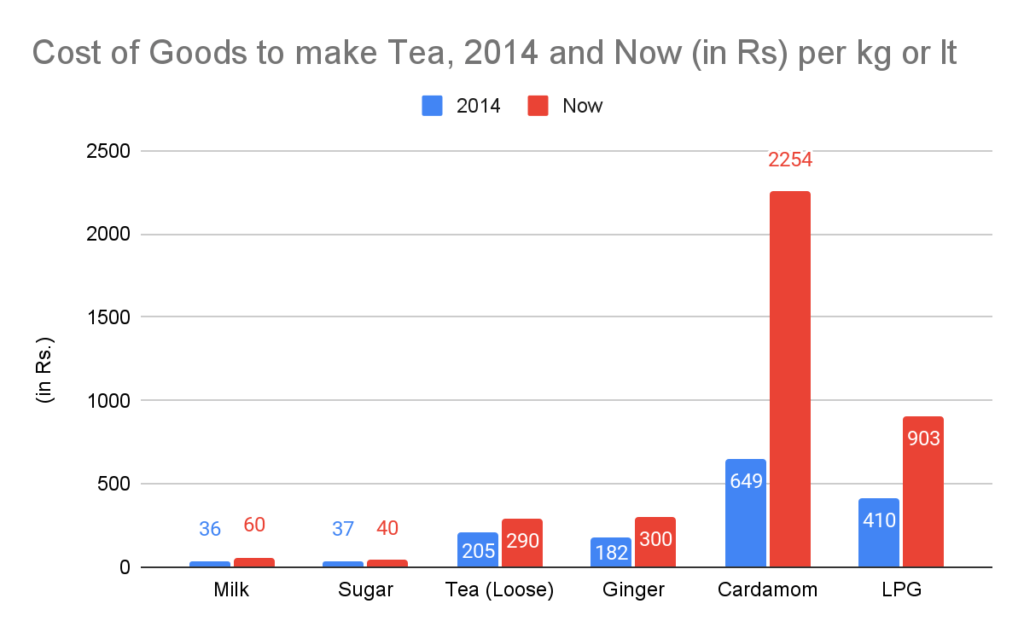
Tea is consistently and daily consumed by 72 per cent of the Indian population (which is slightly more than 100 crore persons). The cost of this items needed to make this quintessential beverage has although, seen a 153 per cent hike since 2014 with the cost of milk, sugar, tea, ginger, cardamom and LPG all seeing a surge. Most notably, cardamom was priced at Rs 649 per kg in 2014 and costs Rs 2254 per kg now. Similarly, the cost of coffee-making essentials (milk, sugar, coffee, LPG) has also surged by 112 per cent.

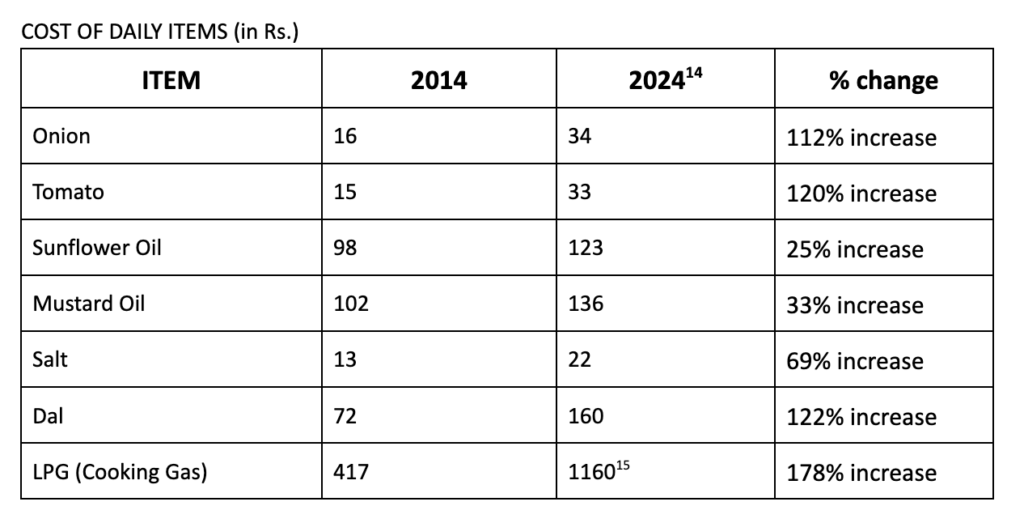
The story is no different for other kitchen essentials. Dietary staples like Dal and LPG prices have soared.

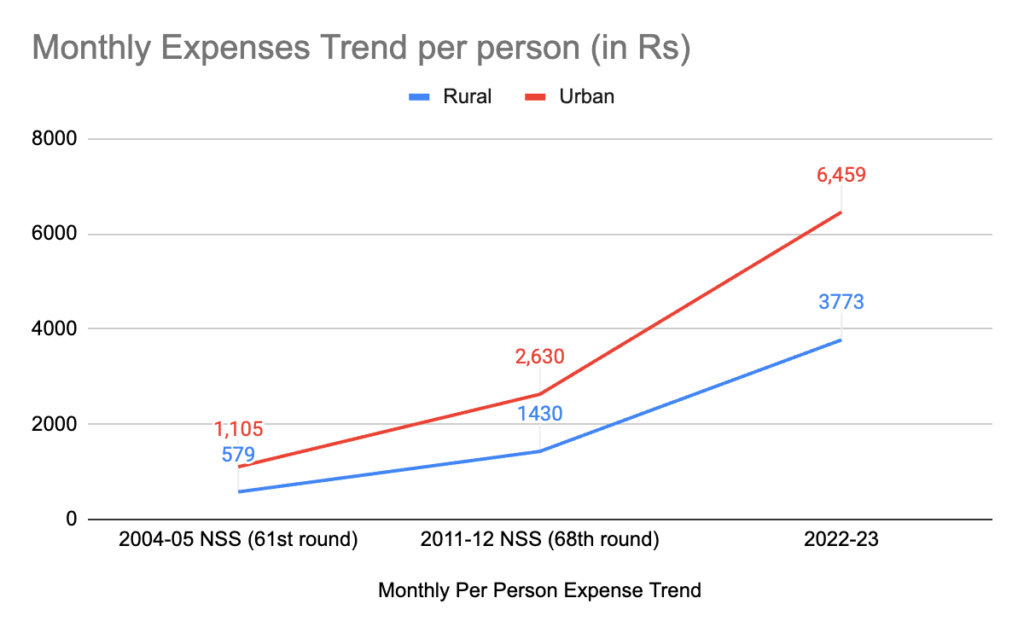
As the prices of essential kitchen items and daily consumables continue to climb, household expenditure has followed suit. Data from the Government’s National Statistical Survey Office (NSSO) reports, published by the Ministry of Statistics and Program Implementation in 2004, 2011, and 2022, reveal a significant uptrend in monthly expenditure per person since 2012.

Urban areas have experienced a threefold increase in monthly expenditure per person since 2012, while rural areas have seen a notable 163 per cent rise over the same period. These findings underscore the mounting financial strain on households, necessitating a closer examination of factors contributing to the escalating cost of living.
Average household savings
India’s household savings rate (the ratio of household savings to household income) is at a 5 decade low at 5.10 per cent, down from 7.10 per cent in 2014-15 (NITI Aayog, December 2023). When looked at alongside the population surge of 20 crore people, average savings of a person in 2014 were approximately ₹6,200 annually, whereas this figure dropped to roughly ₹5,700 in 2023.

The Constitution says….
In conclusion, it must be said that in the light of rising inflation, widening unemployment, depleting savings, and growing inequality, it is crucial to take stock of their profound and compounded implications, not only for the country as a whole but for our individual families and our overall quality of life.
Article 39 of the Indian Constitution, enshrined within the Directive Principles of State Policy, emphasizes the government’s responsibility to ensure:
- The right to adequate means of livelihood for all citizens
- Equitable distribution of community resources for the common good
- Prevention of the concentration of wealth and means of production
With elections ongoing, it is imperative to understand the status of our country’s economic affairs so that we can demand policies that strive to foster sustainable and equitable growth from the upcoming government.
Aditi Anand and Adrian D’Cruz work with Wada Na Todo Abhiyan, which is a people-led campaign, formed by over 3000 Civil Society Organisations in 2004, to promote governance accountability while reflecting the needs and voices of marginalized communities.

